City of Logan Economic Analysis June 2020
Recent data releases for the 2019/2020 financial year are now available, showing Logan’s strong position leading into the start of the pandemic. Data has been compiled from multiple sources, and more detail for most categories is available from economy.id.
Summary of this data can be found in the pdf copy of the City of Logan Economic Analysis June 2020
Gross Regional Product (GRP)
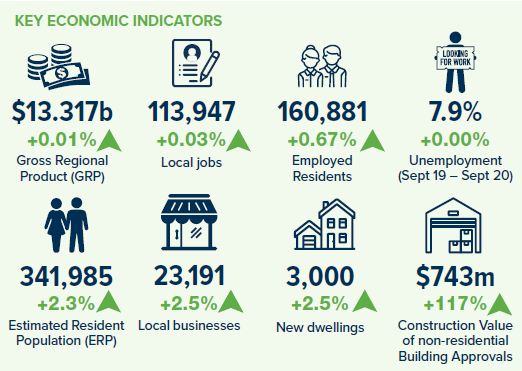
The City of Logan’s Gross Regional Product was $13.317b as of the 30th June 2020. Growth was flat at 0.01%, as the June 2019 figure was $13.315b. GRP has risen 15.6% since 2015.
Queensland’s GRP fell 0.5% from June 2019 to June 2020.
| Year (ending June 30) | $GRP $m | % change from previous year |
|---|---|---|
| 2020 | 13,317 | +0.01 |
| 2019 | 13,315 | +2.90 |
| 2018 | 12,939 | +5.89 |
| 2017 | 12,219 | +3.47 |
| 2016 | 11,809 | +2.53 |
| 2015 | 11,518 | +0.96 |
Local Jobs
There were 113,947 jobs located in Logan City in the year ending June 2020. This represents a 0.03% increase from 113,916 jobs at June 2019.
* Note: jobs are not necessarily full-time and the value of a job varies across areas.
Employed Residents
There were 160,811 City of Logan residents employed in the year ending June 2020. This represents a 0.67% increase from 159,747 residents employed at June 2019.
| Year (ending June 30) | Number | % change |
|---|---|---|
| 2020 | 160,811 | +0.67 |
| 2019 | 159,747 | +1.75 |
| 2018 | 156,995 | +6.65 |
| 2017 | 147,209 | +2.98 |
| 2016 | 142,943 | +2.57 |
| 2015 | 139,361 | -1.32 |
Unemployment
In the 2020 June quarter, the unemployment rate in Logan City was 7.4%. This has dropped from 7.8% in the previous quarter.
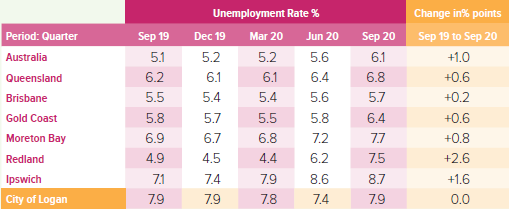
Recently released Unemployment figure from National Skills Commission for September 2020 quarter is 7.9%.
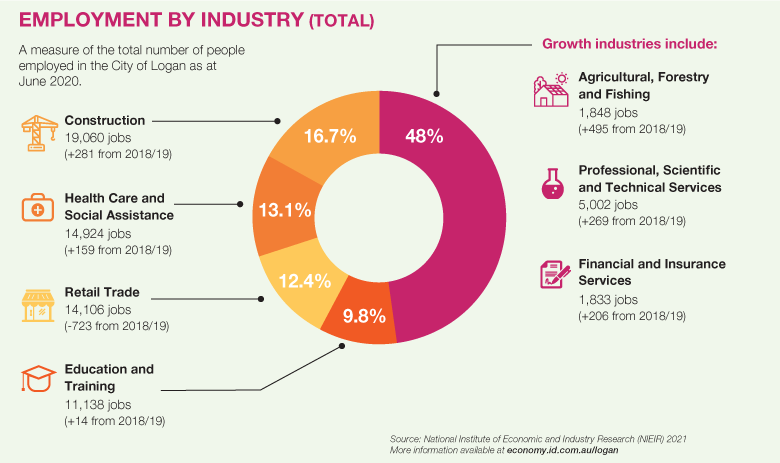
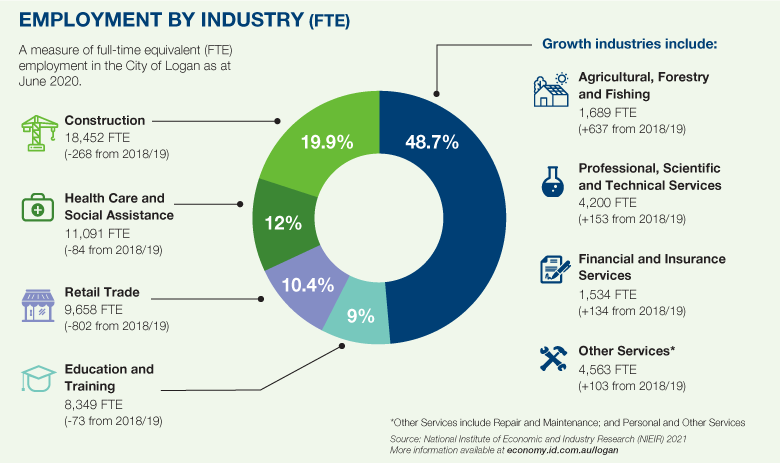
Industry
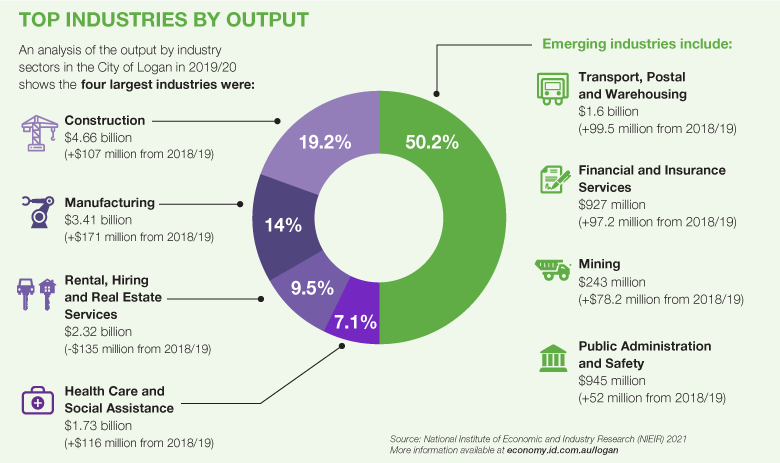
In the City of Logan, Construction had the largest output by industry, generating $4.661 billion in 2019/20, an increase of $107 million from 2018/2019.
Other top industries by output include:
- Manufacturing – $3.41b (+$171m)
- Rental, Hiring and Real Estate Services – $2.32b (-$135m)
- Health Care and Social Assistance – $1.73b (+$116m)
- Transport, Postal and Warehousing – $1.6b (+$99.5m)
Five industries saw a reduction of output in the 12 months to June 2020:
- Rental, Hiring and Real Estate Services (particularly Property Operators and Real Estate Services) – $2.32b (-$135m)
- Professional, Scientific and Technical Services – $975m (-$44.3m)
- Wholesale Trade – $1.35b (-$17.7m)
- Administrative and Support Services (particularly Building Cleaning, Pest Control and Other Support Services) – $895m (-$12.9m)
- Agriculture, Forestry and Fishing – $164m (-$1.5m)
Population
The Estimated Resident Population (ERP) for the City of Logan Local Government Area is 341,985 as at 30 June 2020. This represents a 2.28% increase from June 2019.
Top growth suburbs by population (SA2 – Statistical Areas Level 2)
- Chambers Flat – Logan Reserve (+13.2%)
- Wolffdene – Bahrs Scrub (+10.8%)
- Boronia Heights – Park Ridge (+8.1%)
- Greenbank (+7.8%)
- Jimboomba (+5.8%)
| Year (ending June 30) | Number | Change in number | Change in percent |
|---|---|---|---|
| 2020 | 341,985 | 7,627 | 2.28 |
| 2019 | 334,358 | 7,864 | 2.41 |
| 2018 | 326,494 | 6,007 | 1.87 |
| 2017 | 320,487 | 5,976 | 1.90 |
| 2016 | 314,511 | 5,169 | 1.67 |
City Pulse – Development Activity Highlights
- Non-residential – There was a significant increase of new non-residential development approvals in terms of approved Gross Floor Area (GFAm²) for 2019/2020 up 61.5% from 2018/2019.
- Building Approval increases have been driven by strong growth in Warehouse Distribution and Logistics demand (219,320m² in 2019/2020).
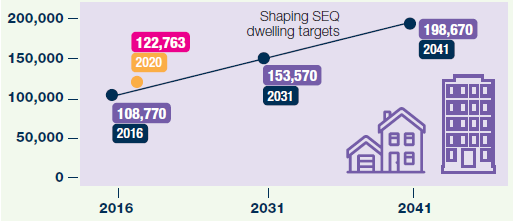
- 3,000 dwellings have been added to the city’s housing stock (122,763). Of these additional dwellings the most popular dwelling type was Stand-alone house, followed by House with secondary/auxiliary unit, then followed by Duplex/Townhouse.
- Logan is on track to deliver our dwelling number targets that are set by the State Government’s SEQ Regional Plan (ShapingSEQ). As at June 2020 we have 122,763 dwellings, moving towards 198,670 by 2041.
View City Pulse for more development related data.


