Recent data releases for the 2020/2021 financial year are now available, showing Logan’s strong position emerging from the initial negative impacts of the pandemic. Data has been compiled from multiple sources, and more detail for most categories is available from economy.id. A pdf version of the headline data can be accessed by viewing the fact sheet.
Key Economic Indicators

$14.36b (+6.55%)
Gross Regional Product (GRP)

117,248 (+3.5%)
Local Jobs

164,481 (+2.5%)
Employed Residents

8.7% (+0.5%)
Unemployment
(Dec 20-Dec 21)

348,020 (+1.8%)
Estimated Resident Population (ERP)

23,409 (+4.5%)
Local Businesses

3,209 (+2.6%)
New Dwellings

129,711m² (+58%)
Gross Floor Area of non-residential Development Approvals
Gross Regional Product (GRP)
The City of Logan’s economy took a hit in 2019/2020 due to the ongoing effects of COVID-19, with a revised GRP of $13.39b and a growth rate of -0.79%. However in 2020/2021, the economy has surged back to growth posting the largest increase in GRP since 2007 at 6.55%. The City of Logan’s GRP was $14.364 as of 30 June 2021. The 5-year average in GRP growth is 3.45%.
For the same period of 2020/2021, the Gross State Product (GSP) for Queensland saw growth of 3.84%, which also marked a return to growth after -0.18% growth in 2019/2020.
Local Jobs
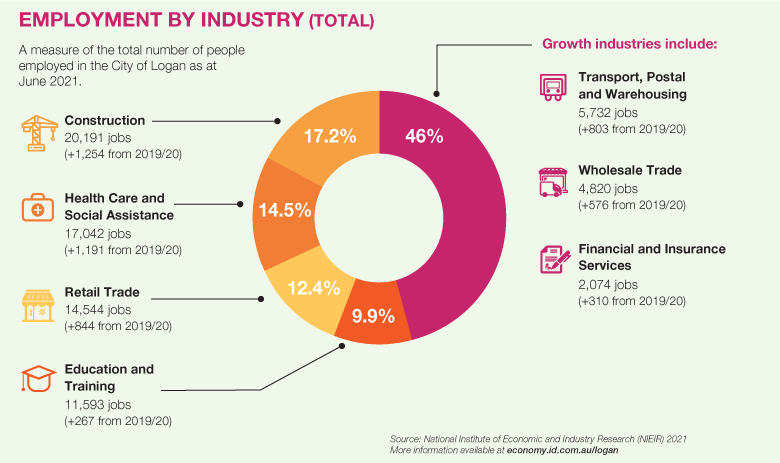
There were 117,248 jobs located in Logan City in the year ending June 2021. This represents a 3.53% increase from 113,249 jobs at June 2020.
The Construction industry is the highest employing industry in the City of Logan, with 20,191 jobs as at 30 June 2021. This is an increase of 1,254 jobs from 2019/2020.
Other top employing industries include:
- Health Care and Social Assistance: 17,042 jobs (+1,191 from 2019/20)
- Retail Trade: 14,544 jobs (+844 from 2019/20)
- Education and Training: 11,593 jobs (+267 from 2019/20)
In combination these four industries accounted for 63,370 people in total or 54% of the local workers.
Other industries that saw positive jobs growth in the financial year include:
- Transport, Postal and Warehousing: 5,732 jobs (+803 from 2019/20)
- Wholesale Trade: 4,820 jobs (+576 from 2019/20)
- Financial and Insurance Services: 2,074 jobs (+310 from 2019/20)
Industries that saw a reduction in total jobs in the city for the 2020/2021 financial year include:
- Agriculture, Forestry and Fishing (-704)
- Accommodation and Food Services (-268)
- Administrative and Support Services (-111)
- Public Administration and Safety (-344)
- Arts and Recreation Services (-24)
- Repair and Maintenance (-449)
* Note:
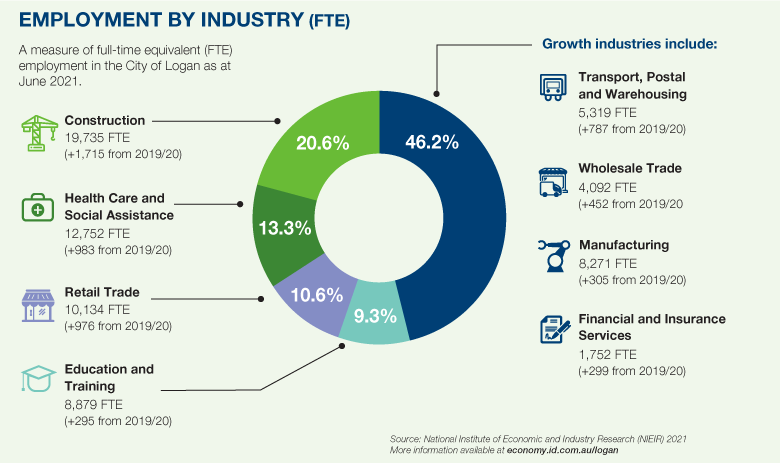
- jobs are not necessarily full-time and the value of a job varies across areas. For Full-time equivalent jobs see economy.id
- Source: National Institute of Economic and Industry Research (NIEIR) 2021. More information is available at economy.id.com.au/logan
Employed Residents
There were 164,481 City of Logan residents employed in the year ending June 2021. This represents a 2.47% increase from 160,510 residents employed at June 2020. Journey to work data will be published in the next data set with updated data from the 2021 Census – this will provide an overview of how many Logan residents are travelling outside the Local Government Area for work and who are working within the city.
Unemployment
In the 2021 June quarter, the unemployment rate in Logan City was 9.1%. This is significantly higher than 7.4% at June 2020.
Recently released Unemployment figures from the National Skills Commission for December 2021 quarter is 8.7%, which is down from 9.2% in the September 2021 quarter.
Note: The Department of Employment advise that highly disaggregated labour force and unemployment estimates at the LGA level can display significant variability and should be viewed with caution. The figures are smoothed using a four-quarter (annual) average to minimise the variability inherent in small area estimates.
Industry
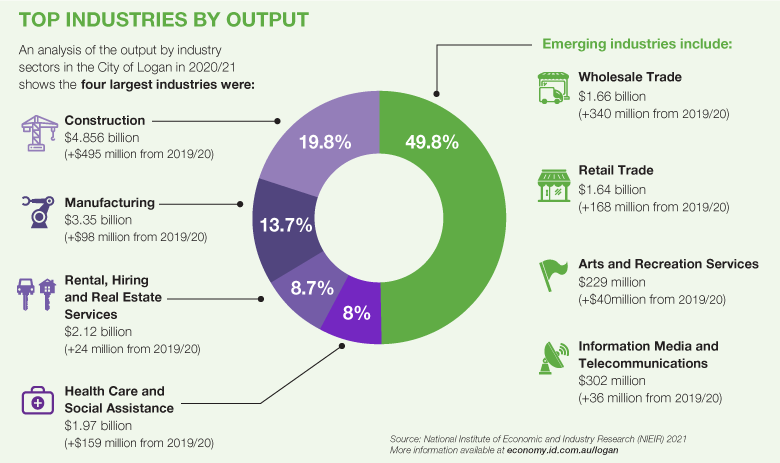
In the City of Logan, Construction had the largest output by industry, generating $4.85 billion in 2020/21, an increase of $495 million from the revised 2019/20 figure of $4.35b.
Other top industries by output include:
- Manufacturing: $3.35b (+$98m)
- Rental, Hiring and Real Estate Services: $2.12b (+24m)
- Health Care and Social Assistance: 1.97b (+$159m)
Other industries with positive growth in the 2020/2021 financial year include:
- Wholesale Trade: $1.66b (+$340m)
- Retail Trade: $1.64b (+$168m)
- Arts and Recreation Services (particularly Sports and Recreation Activities): $229m (+$40m)
- Information Media and Telecommunications: $302m (+$36m)
Source: National Institute of Economic and Industry Research (NIEIR) 2021. More information is available at economy.id.com.au/logan
Seven industries saw a reduction in output in the 12 months to June 2021:
- Administrative and Support Services: $500.9m (-$40.7m)
- Transport, Postal and Warehousing: $461m (-$36.3m)
- Agriculture, Forestry and Fishing: $107.8m (-$27.1m)
- Electricity, Gas, Water and Waste Services: $210.5m (-5.8m)
- Public Administration and Safety: $556m (-3m)
- Accommodation and Food Services: $243.2m (-0.6m)
Population
The Estimated Resident Population (ERP) for the City of Logan Local Government Area is 348,020 as at 30 June 2021. This represents a 1.8% increase from June 2020.
Top growth suburbs by population (SA2 – Statistical Areas Level 2)
- Chambers Flat – Logan Reserve (12.1%)
- Wolffdene – Bahrs Scrub (10%)
- Boronia Heights – Park Ridge (8.1%)
- Greenbank (7.9%)
- Jimboomba (+4.9%)
Development Activity Highlights
- Non-residential – There has been a continued increase of new non-residential development approvals in terms of approved Gross Floor Area (GFA m²) for 2020/2021 up 58% from 2019/2020.
- Building approval increases have been driven by strong growth in Warehouse, Distribution and Logistics demand (almost 200,000m² new Gross Floor Area in 2020/2021).
- Over 3,000 new dwellings have been added to the city’s housing stock (125,972 as at June 2021). Of these additional dwellings, the most popular dwelling type was a stand-alone house, followed by a house with a secondary dwelling/auxiliary unit.
- Logan is on track to deliver our dwelling number targets that are set by the State Government’s SEQ Regional Plan. As at June 2021 we have 125,972 dwellings moving towards 198,670 by 2041.
Housing Data
City of Logan residential sales
| 2019/2020 | 2020/2021 | Change (value) | Change (%) | |
|---|---|---|---|---|
| House | 4,563 | 6,263 | 1,700 | 37.3% |
| Unit/Townhouse | 749 | 1,094 | 345 | 46.1% |
Dwelling sales – Top 5 suburbs
| Suburb | FY 2019/2020 | FY 2020/2021 | Change (value) | Change (%) |
|---|---|---|---|---|
| Rochedale South | 203 | 256 | 53 | 26.1% |
| Marsden | 163 | 249 | 86 | 52.8% |
| Shailer Park | 176 | 245 | 69 | 39.2% |
| Crestmead | 164 | 237 | 73 | 44.5% |
| Park Ridge | 145 | 231 | 86 | 59.3% |
Unit/Townhouse sales – Top 5 suburbs
| Suburb | 2019/2020 | 2020/2021 | Change (value) | Change ($) |
|---|---|---|---|---|
| Woodridge | 56 | 144 | 88 | 157.1% |
| Eagleby | 79 | 84 | 5 | 6.3% |
| Marsden | 47 | 83 | 36 | 76.6% |
| Beenleigh | 56 | 79 | 23 | 41.1% |
| Springwood | 45 | 76 | 31 | 68.9% |
City of Logan median sale prices
| 2019/2020 | 2020/2021 | Change (value) | Change (%) | |
|---|---|---|---|---|
| House | $430,000 | $449,980 | $19,980 | 4.6% |
| Unit/Townhouse | $240,000 | $230,500 | -$9,500 | -4.0% |
Median sale prices of houses – Top 5 growth suburbs
by percentage increase
| Suburb | 2019/2020 | 2020/2021 | Change (value) | Change (%) |
|---|---|---|---|---|
| Carbrook | $825,000 | $1,200,000 | $375,000 | 45.5% |
| Munruben | $545,000 | $672,000 | $127,000 | 23.3% |
| Windaroo | $477,500 | $585,000 | $107,500 | 22.5% |
| Woodhill | $500,000 | $598,000 | $98,000 | 19.6% |
| Tamborine | $608,750 | $720,000 | $111,250 | 18.3% |
Median sale prices of units/townhouses – Top 5 growth suburbs
by percentage increase
| Suburb | 2019/2020 | 2020/2021 | Change (value) | Change (%) |
|---|---|---|---|---|
| Marsden | $250,000 | $335,000 | $85,000 | 34% |
| Tanah Merah | $233,500 | $310,000 | $76,500 | 32.8% |
| Waterford | $245,000 | $313,750 | $68,750 | 28.1% |
| Underwood | $306,500 | $345,000 | $38,500 | 12.6% |
| Cornubia | $297,150 | $325,000 | $27,850 | 9.4% |
