Building Approvals
City of Logan Residential Building Approvals
Total new dwellings building approved from 2010/2011 to 2020/2021 (part year July-December 2020)
The graph below illustrates the number of new approved residential dwellings per financial year has eased from the 2017/2018 peak period.
Hover mouse over plot points for values
Total new dwellings building approved by housing type from 2010/2011 to 2020/2021 (part year July-December 2020)
Housing type | 10/11 | 11/12 | 12/13 | 13/14 | 14/15 | 15/16 | 16/17 | 17/18 | 18/19 | 19/20 | 20/21 (part) | Total |
---|---|---|---|---|---|---|---|---|---|---|---|---|
Unit / apartment | 227 | 320 | 355 | 43 | 122 | 226 | 109 | 308 | 228 | 75 | 101 | 2,114 |
Duplex / townhouse | 442 | 304 | 214 | 218 | 261 | 216 | 304 | 157 | 510 | 89 | 18 | 2,733 |
Stand-alone house | 1,188 | 824 | 780 | 1,239 | 1,884 | 2,063 | 2,095 | 2,334 | 2,102 | 1,846 | 1,250 | 17,605 |
House with auxiliary unit | 6 | 2 | 4 | 6 | 56 | 326 | 530 | 846 | 612 | 646 | 332 | 3,366 |
Secondary dwelling for existing dwelling | 48 | 47 | 66 | 61 | 96 | 115 | 183 | 286 | 136 | 85 | 52 | 1,175 |
Other dwelling | 75 | 123 | 61 | 58 | 114 | 85 | 51 | 43 | 19 | 34 | 0 | 663 |
Retirement dwelling | 71 | 66 | 82 | 46 | 13 | 65 | 103 | 109 | 90 | 77 | 11 | 733 |
Total new dwellings | 2,057 | 1,686 | 1,562 | 1,671 | 2,546 | 3,096 | 3,375 | 4,083 | 3,697 | 2,852 | 1,764 | 28,389 |
Total dwellings demolished | 63 | 45 | 55 | 57 | 68 | 89 | 99 | 125 | 154 | 147 | 60 | 962 |
TOTAL NET new dwellings | 1,994 | 1,641 | 1,507 | 1,614 | 2,478 | 3,007 | 3,276 | 3,958 | 3,543 | 2,705 | 1,704 | 27,427 |
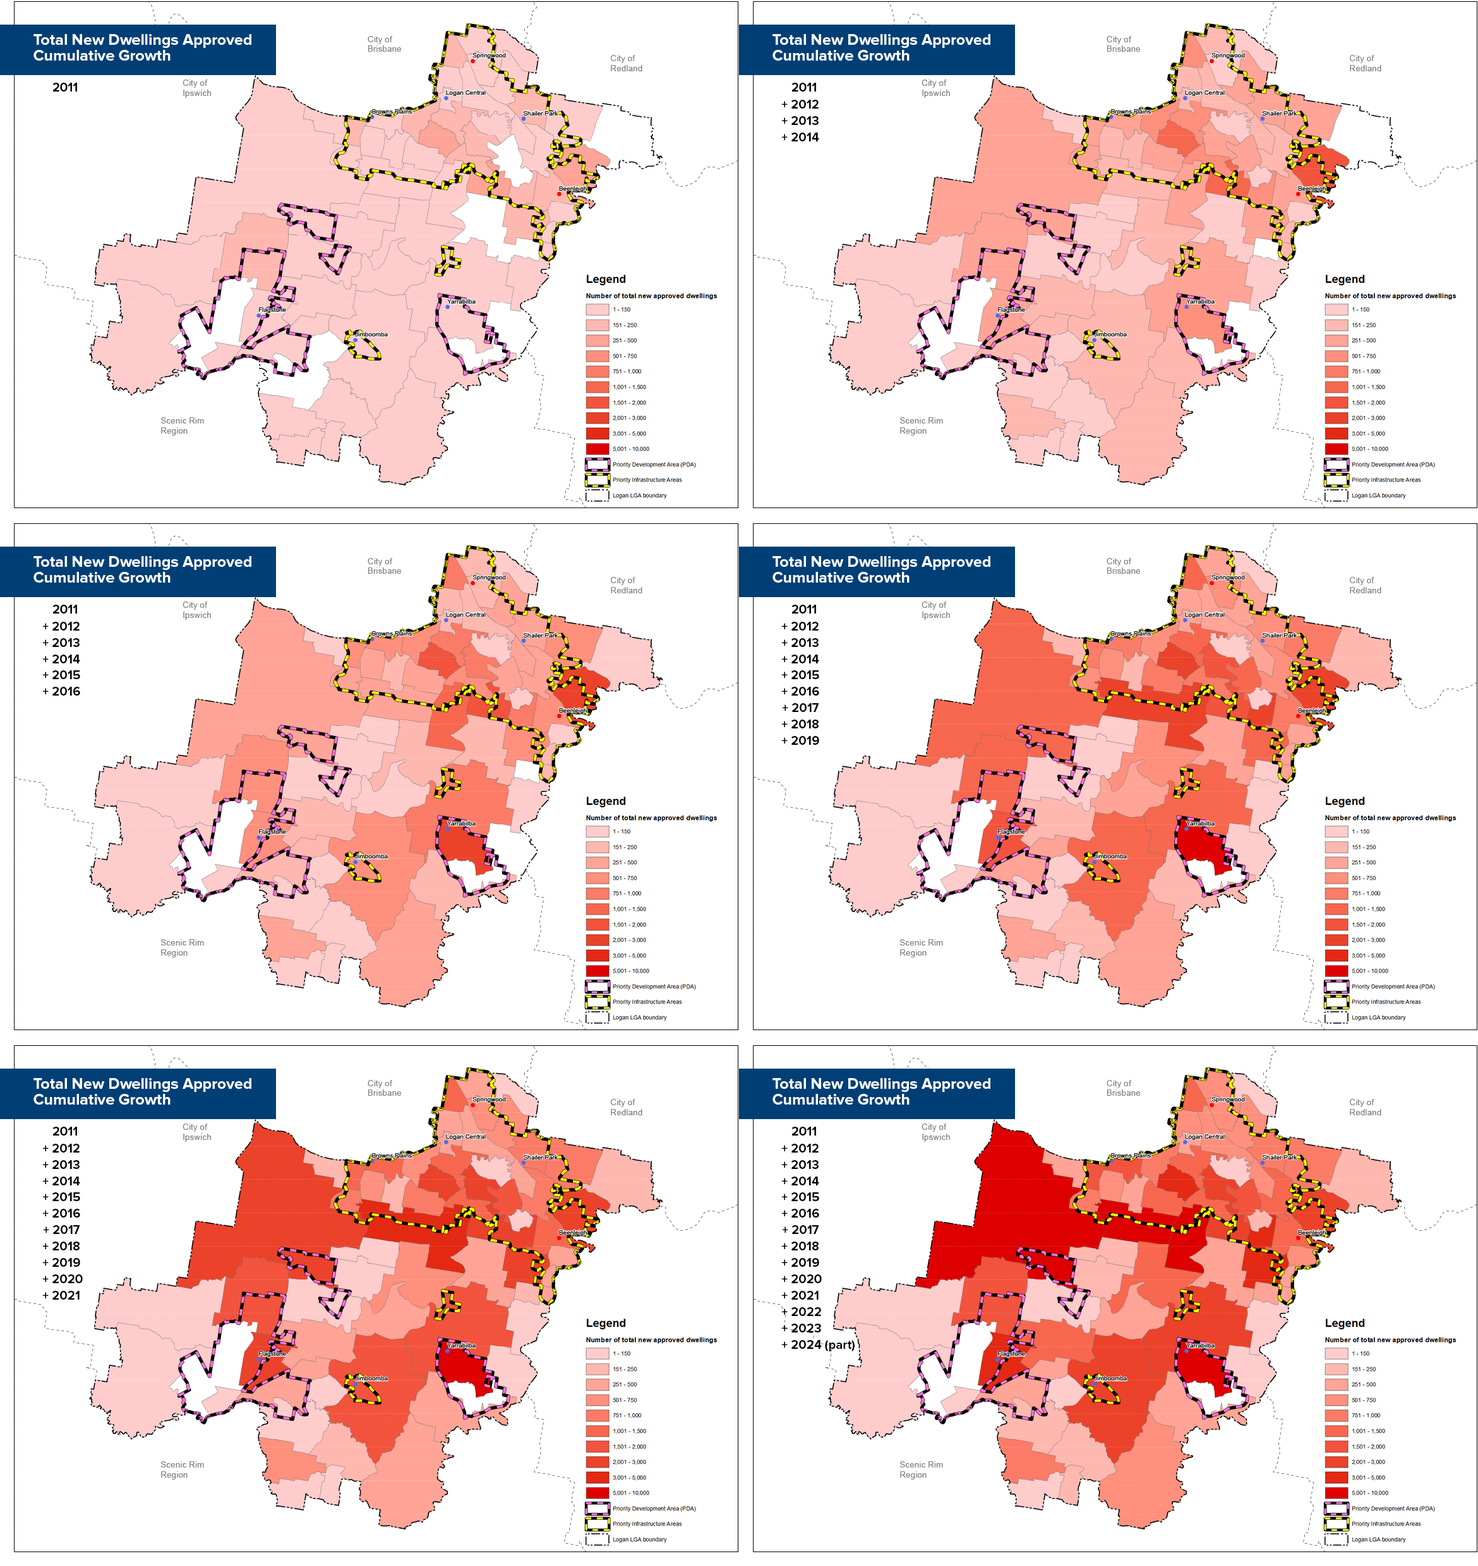
Growth per financial year – Cumulative growth
Construction value of building approved new dwellings and other residential types (1) from 2010/2011 to 2020/2021 (part year July-December 2020)
- Includes the construction value of new care and other facilities with long term residency.
Construction value of other building approved residential works (1) from 2010/2011 to 2020/2021 (part year July-December 2020)
- Includes the construction value of all residential related renovations, extensions and demolitions.
Median construction value of selected housing types from 2010/2011 to 2020/2021 (part year July-December 2020)
- The median construction value for stand-alone house is for houses on a lot less than 2,000m².
Average Gross Floor Area (GFA) (1) (2) of a stand-alone house from 2010/2011 to 2020/2021 (part year July-December 2020)
- GFA is defined as the habitable area of the Stand-alone house and excludes garages, patios, porches and storage areas.
- The average gross floor area (GFA) for stand-alone house is for houses on a lot less than 2,000m2.
Average lot size (1) of a stand-alone house from 2010/2011 to 2020/2021 (part year July-December 2020)
- The average lot size for a stand-alone house is for houses on a lot less than 2,000m2.
Average Gross Floor Area (GFA) (1) of a house with auxiliary unit from 2010/2011 to 2020/2021 (part year July-December 2020)
- GFA is defined as the habitable area of the House with auxiliary unit and excludes garages, patios, porches and other storage areas.
- The average gross floor area (GFA) for House with auxiliary unit on lots less than 2,000m2.
Average lot size of a house with auxiliary unit from 2010/2011 to 2020/2021 (part year July-December 2020)
- The average lot size for a house with auxiliary unit is for houses with auxiliary units on a lot less than 2,000m2.
City of Logan Non-Residential Building Approvals
Construction value of building approved new non-residential Gross Floor Area (GFA) (1) from 2010/2011 to 2020/2021 (part year July-December 2020)
- Includes the estimated construction value of non-residential building approvals that result in new GFA.
Construction value of building approved other non-residential building work (1) from 2010/2011 through to 2020/2021 (part to December 2020)
- Includes the construction value of all non-residential related tenancy fitouts, renovations, refurbishments, and demolitions.
New non-residential Gross Floor Area (GFA) building approved by type from 2010/2011 to 2020/2021 (part year July-December 2020)
- The graph below illustrates that the majority of new GFA is generated by the Warehouse, distribution and logistics land use category
- The graph below also highlights a sharp increase in new GFA building approved in the 2019/2020 financial year period
Type | 10/11 | 11/12 | 12/13 | 13/14 | 14/15 | 15/16 | 16/17 | 17/18 | 18/19 | 19/20 | 20/21 (part) |
---|---|---|---|---|---|---|---|---|---|---|---|
Retail and services | 4,445 | 857 | 8991 | 14,855 | 11,760 | 18,979 | 9,721 | 26,931 | 11,972 | 45,573 | 11,637 |
Showroom & Bulk Goods | 223 | 250 | 14,161 | 2,125 | 13,554 | 1,548 | 0 | 634 | 1,493 | 128 | 0 |
Office | 3,723 | 2,821 | 4,458 | 3,064 | 10,705 | 8,152 | 17,496 | 5,042 | 9,085 | 15,167 | 559 |
Education | 31,035 | 9,879 | 2,704 | 7,809 | 2,202 | 8,691 | 13,616 | 12,665 | 16,185 | 11,776 | 4,223 |
Health | 0 | 0 | 297 | 0 | 0 | 0 | 69 | 0 | 0 | 0 | 3950 |
Community Other | 4,278 | 2,402 | 2,655 | 860 | 4,397 | 1,321 | 7,302 | 2,781 | 3,660 | 21,135 | 5,643 |
Sport, Tourism & Recreation | 1,954 | 261 | 325 | 454 | 31 | 1,043 | 331 | 80 | 402 | 524 | 64 |
Low Impact Industry | 4,409 | 5,541 | 18,561 | 9,284 | 3,817 | 2,819 | 13,080 | 16,364 | 4,273 | 6,951 | 4,270 |
Medium Impact Industry | 8,836 | 1,445 | 16,938 | 2,025 | 4,605 | 10,993 | 0 | 660 | 16,529 | 0 | 1,901 |
High Impact Industry | 26 | 36 | 0 | 0 | 728 | 0 | 0 | 0 | 0 | 250 | 0 |
Warehouse, Distribution & Logistics | 4,932 | 17,526 | 51,280 | 16,986 | 15,389 | 32,729 | 84,220 | 66,795 | 67,130 | 224,523 | 4,502 |
Rural | 2,056 | 200 | 171 | 282 | 0 | 3,079 | 0 | 0 | 393 | 4,104 | 0 |