Logan City Council collects key economic statistics and information to measure how the city is performing. This information has been compiled into the 2023/24 Economic Update. Most of the data is from the end June 2024 reporting period, but is noted if the data set contains data from different time periods. Links to relevant data sources are included where possible.
View the City of Logan Economic Update 2023-24 pdf
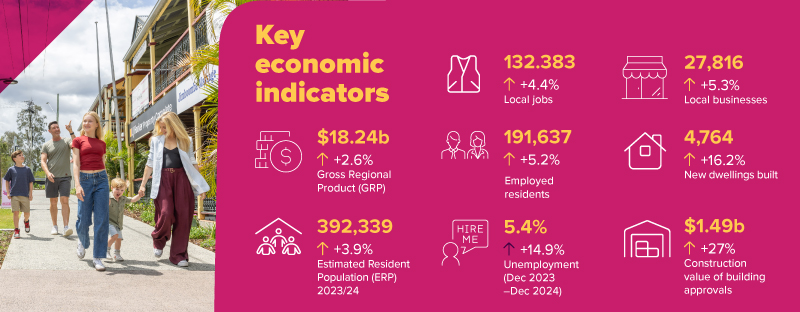
Key Economic Indicators
Gross Regional Product (GRP)
The City of Logan’s Gross Regional Product (GRP) at June 2024 was $18.24 billion, an increase of 2.6% since June 2023.
Growth has continued to moderate since the post-COVID surge. The state Gross State Product growth for the same period was 2.95%.
The reduction in GRP growth rate can be attributed to a downturn in Manufacturing, Accommodation and Food Services, and Retail Trade in the city.
|
Year
(ending 30 June) |
GRP
($m) |
%
change from previous year |
|
2024 |
18,242 |
+2.6 |
|
2023 |
17,780 |
+4.92 |
|
2022 |
16,946 |
+6.83 |
|
2021 |
15,863 |
+7.64 |
|
2020 |
14,737 |
-1.14 |
|
2019 |
14,907 |
+2.08 |
Industry
Health Care and Social Assistance has overtaken Construction as the biggest industry by economic contribution, generating $2.07 billion in 2023/24. Total output by this industry is $2.96 billion, whereas the output of the Construction industry is $7.88 billion.
Manufacturing is the city’s biggest exporter with a value of $1.14 billion (+345 million since 2022/23). Primary Metal and Metal Product Manufacturing, Food Manufacturing, Machinery and Equipment Manufacturing, Wood Product Manufacturing and Transport Equipment Manufacturing make up the majority of this industry.
Top value adding industries
- Healthcare and social assistance
$2.07 billion
(+$99.8 million from 2022/23)
- Construction
$2.07 billion
(+$29 million from 2022/23)
- Manufacturing
$1.34 billion
(-$19.6 million from 2022/23)
- Retail Trade
$1.13 billion
(+$13.8 million from 2022/23)
Growth industries include
- Education and Training: $1.02 billion (+$47 million from 2022/23)
- Repair and Maintenance: $453 million (+$46 million from 2022/23)
- Transport, postal and warehousing: $954 million (+$44 million from 2022/23)
- Public Administration and Safety: $722 million (+$36 million from 2022/23)
Five industries saw a reduction in value added in the 12 months to June 2024
- Wholesale Trade: $938 million (-$81 million)
- Accommodation and Food Services: $415 million (-$25.7 million)
- Manufacturing: $1.34 billion (-$19.6 million)
- Administrative and Support Services: $539 million (-$16.5 million)
- Electricity, Gas, Water and Waste Services: $310 million (-$11 million)
The top performing industries over the last 5 years are
- Health Care and Social Assistance: +$679m
- Construction: +$511m
- Rental, Hiring and Real Estate Services: +$166m
- Transport, Postal and Warehousing: +$145m
- Public Administration and Safety: +$144m
- Education and Training: +$143m
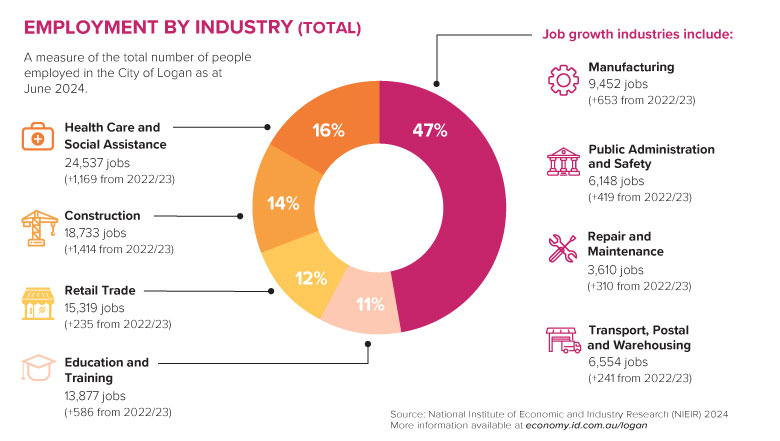
Employment
The top employing industries as at June 2024
- Health Care and Social Assistance – 24,537 jobs (+1,169 from June 2023)
- Construction – 18,733 jobs (+1,414)
- Retail Trade – 15,319 jobs (+235)
- Education and Training – 13,877 jobs (+586)
Job growth industries include
- Manufacturing – 9,542 jobs (+653 from 2022/23)
- Public Administration and Safety – 6,148 jobs (+419)
- Repair and Maintenance – 3,610 jobs (+310)
- Transport, Postal and Warehousing – 6,554 jobs (+241)

Local Jobs
There were 132,383 jobs located in the City of Logan in the year ending June 2024. This represents a 4.41% increase from 126,786 jobs at June 2023.
Logan has recorded strong local jobs growth of 20% from June 2020 to June 2024. Local jobs growth has exceeded population growth for the last 4 years, as well as being above the Queensland average jobs growth rate for the last decade, excluding the COVID year in 2020.
|
Year (ending 30 June) |
Local jobs |
% change from previous year |
|
2024 |
132,383 |
+4.41 |
|
2023 |
126,786 |
+5.26 |
|
2022 |
120,446 |
+6.26 |
|
2021 |
113,346 |
+2.65 |
|
2020 |
110,415 |
-1.54 |
|
2019 |
112,142 |
+1.75 |
The 2021 Census data showed that for the 102,853 local jobs in the city, 59% of those were occupied by Logan residents. The other 41% of workers live in other Council areas and commute into the city for work. Main residential locations include Brisbane (20.4%), Gold Coast (8.7%), Redland (4.2%) and Ipswich (3.6%).
Local workers
Of the 151,633 employed Logan residents in the 2021 Census data, 40% live and work in the City of Logan, 54.1% travel outside the city for work, and 5.9% have no fixed place of work. Brisbane was the main employment centre, with 57,120 (37.7%) Logan residents travelling to the Brisbane Council area for work.
Employed locals
There were 191,637 Logan residents in employment at June 2024. This is a 5.2% increase from 182,245 from June 2023.
Unemployment (Dec 2024 data)
The unemployment rate hit its lowest point in March 2024 at 4.6% and began to trend upwards before dipping again in the December 2024 quarter.
|
|
Unemployment Rate % |
Change in % points |
|
Period: Quarter |
Dec-23 |
Mar-24 |
Jun-24 |
Sep-24 |
Dec-24 |
Dec 23 to Dec 24 |
|
Australia |
3.7 |
3.8 |
3.9 |
4.0 |
4.0 |
+8% |
|
Queensland |
4.0 |
4.0 |
4.1 |
4.1 |
4.0 |
0 |
|
Brisbane |
3.6 |
3.7 |
3.9 |
3.8 |
3.7 |
+3% |
|
Gold Coast |
3.2 |
3.6 |
3.4 |
3.5 |
3.5 |
+9% |
|
Ipswich |
4.6 |
4.8 |
5.2 |
5.7 |
5.6 |
+22% |
|
Moreton Bay |
5.2 |
5.5 |
5.4 |
5.2 |
4.8 |
-8% |
|
Redland |
3.9 |
3.6 |
3.4 |
3.2 |
3 |
-23% |
|
Scenic Rim |
3.9 |
4.0 |
4.2 |
4.5 |
4.5 |
+15% |
|
City of Logan |
4.7 |
4.6 |
5.2 |
5.8 |
5.4 |
+15% |
Areas with the lowest unemployment rate
- Cornubia – Carbrook – 1.7%
- Shailer Park – 1.9%
- Flagstone (West) – New Beith – 2.1%
- Daisy Hill – 2.2%
- Wolffedene – Bahrs Scrub – 2.2%
- Springwood – 2.3%
- Logan Village – 2.3%
- Rochdale South – Priestdale – 2.5%
Areas with the highest unemployment rate
- Logan Central – 20.9%
- Woodridge – 17.9%
- Kingston – 16.2%
- Loganlea – 9.7%
- Slacks Creek – 9.7%
Areas with most improved unemployment rate over the last 12 months
- Munruben – Park Ridge South (2.9% to 2.6%) -10%
- Daisy Hill (2.2%) unchanged
The Youth Unemployment Rate for Logan – Beaudesert was 11.5% at March 2025. The youth unemployment rate began to climb in December 2023, peaking at 14.2% in Sept 2024 before tracking back down into 2025.
Note the Youth Unemployment Rate is measured at the Statistical Area 4 (SA4) level which includes Beaudesert and south to the QLD/NSW border.
Local Businesses
There was a net increase of 771 local businesses from June 2023 to June 2024, to 27,816 businesses. The highest amount of new businesses were in the Transport, Postal and Warehousing, Construction, and Healthcare and Social Assistance industries.
97.6% of businesses in Logan are sole traders or small businesses (less than 20 employees).
Number of businesses by turnover
- Zero to less than $50k – 6,096
- $50k to less than $200k – 10,153
- $200k to less than $2m – 9,587
- $2m to less than $5m – 1,138
- $5m to less than $10m – 422
- $10m or more – 420
Number of businesses by employment size
- Non employing – 17,135
- 1-4 employees – 7,611
- 5-19 employees – 2,400
- 20-199 employees – 647
- 200+ employees – 23
Population
The Estimated Resident Population of the City of Logan is 392,339 as at June 2024. This is a 3.9% increase from 2022/23 and makes Logan the fastest growing LGA in Queensland. The 5-year average growth rate is 3.8%.
|
LGA |
Population
2023 |
Population
2024 |
Difference
2024-2023 |
% increase |
|
City of Logan |
377,724 |
392,339 |
14,615 |
3.9 |
|
Ipswich |
251,105 |
259,886 |
8,781 |
3.5 |
|
Sunshine Coast |
365,936 |
375,328 |
9,392 |
2.6 |
|
Brisbane |
1,323,481 |
1,355,640 |
32,159 |
2.4 |
|
Moreton Bay |
510,063 |
522,494 |
12,431 |
2.4 |
|
Gold Coast |
666,108 |
681,389 |
15,281 |
2.3 |
|
Redland |
166,799 |
170,225 |
3,426 |
2.1 |
|
Scenic Rim |
45,245 |
46,036 |
791 |
1.7 |
Estimated population growth is highest in the following SA2 areas
- Chambers Flat – Logan Reserve – +19.1% [Highest growth rate in QLD]
- Greenbank – North Maclean – +12.8%
- Yarrabilba – +10.7%
- Wolffdene – Bahrs Scrub – +8%
- Boronia Heights – Park Ridge – +7.6%
Brisbane, Gold Coast, Moreton Bay and Logan were the top 4 LGA’s in QLD for overseas migration. Logan also tops the internal migration figure for QLD (people moving from within Australia) with +7,183 persons. As with last year, we are second nationally in this figure to Melton in Victoria.
Logan has the 3rd highest population density in QLD (behind Brisbane and the Gold Coast).
Tourism
The tourism industry is worth $879 million to Logan’s economy and employs almost 10,000 staff both directly and indirectly. Total output/sales was $1.73 billion in 2023/24 which was a 8.4% increase from 2022/23.
Logan had 1.53 million visitors to the city in 2023/24.
Tourism Research Australia has recommenced measurements of International visitor nights, and Logan has recorded 1.56 million international visitor nights in the city in 2023/24, which is an increase from 1.21 million when last recorded in 2018/19. Visiting Friends and Relatives (VFR) is the dominant market for international visitors to the city (64%) followed by Holiday (26%).
Logan had 1.2 million daytrip visitors to the city in 2023/24, up 4.1% from 2022/23.
Development Activity Highlights
- $2.18 billion estimated construction value of Building Completions in 2023/24, up 35% from $1.62 billion in 2022/23.
- 345,153m² new non-residential Gross Floor Area (GFA) space completed in 2023/24 (excludes mixed use), which is a 36% increase from 2022/23.
- The biggest increases in non-residential growth occurred in Warehouse, Distribution & Logistics with 205,399m² of new floor space (GFA).
- $432,560,566 estimated construction value of new non-residential work (based on Building Approvals – excludes mixed-use, demolitions, alterations and fit-outs).
- 4,275 net new dwellings added to the city’s housing stock in 2023/24. This is an increase from 4,166 dwellings added in 2022/23. Of these additional dwellings, the most popular dwelling type was a stand-alone house, followed by a house with a secondary dwelling/auxiliary unit.
- $369,742 median construction cost for a stand-alone house, up from $309,680 in 2022/23.
- 195 business days The average construction timeframes for residential dwellings from approval to completion in 2023/24 which is a decrease from 203 days in 2022/23.
- $2.28 billion estimated construction value of all new Building Approvals for 2023/24, up 8% from $2.11 billion in 2022/23.
- The City of Logan has more land available for residential development than any other LGA in South East Queensland. Latest figures estimate 8153 broad hectares of supply.
- 137,876 dwellings The South East Queensland Regional Plan 2023 (ShapingSEQ), states that the City of Logan is required to accommodate an additional 110,200 dwellings from 2021 to 2046. By June 2024, 137,876 residential dwellings were recorded in Logan with a growth of 12,176 dwellings from 2021. Based on these updated figures, Logan is required to now facilitate an additional 98,024 residential dwellings by 2046 (approx 4456 dwellings per year).

Top 5 suburbs for residential dwelling completions were
- Greenbank – 856
- Logan Reserve – 746
- Yarrabilba – 582
- Park Ridge – 414
- Jimboomba – 337
Real Estate
Median house prices range from $450,000 in Woodridge to $1.56 million for Carbrook.
The City of Logan has seen median house prices rise by 61.63 per cent from $430,000 in January 2020 to reach a peak of $695,000 in August 2024. In the 12 months to August 2024, house prices grew at 12.10 per cent. This is similar to neighbouring LGA’s.
Logan saw the highest growth in unit prices in Greater Brisbane, with prices rising 81.42 per cent from $226,000 in January 2020 to reach $410,000 in August 2024. With growth of 22.39 per cent in the 12 months to August 2024, unit price growth significantly surpassed that of houses.
Census Comparison Data
To see changes to the City of Logan’s demographic data from the 2016 Census to the 2021 Census, see our fact sheet.
Sources
Australian Bureau of Statistics, Counts of Australian Businesses, including Entries and Exits, 2017 to 2024
Australian Bureau of Statistics, Estimated Resident Population (ERP) and components by Local Government Area 2017 to 2024
Economy.id industry structure and industry sector profiles use a National Accounts regional econometric model developed by National Institute of Economic and Industry Research (NIEIR) economy.id.com.au
Urban Research & Monitoring Unit, Economic Development and City Planning Branch, Logan City Council
Small Area Labour Markets Australia, Australian Government, Department of Employment, Skills, Small & Family Business, ABS State Details
Queensland Government Statistician’s Office – Regional youth unemployment
M3 Property – Brisbane Residential Property Overview December 2024
*Many of the datasets in this economic profile are underpinned by the NIEIR-ID economic model, which is updated each financial year. As benchmarks are changed every year, this can affect historical figures.