Logan Economic Analysis 2022/23
Logan City Council collects key economic statistics and information to measure how the city is performing. This information has been compiled into the 2022/23 Economic Analysis Report. Most of the data is from the end June 2023 reporting period, but is noted if the data set contains data from different time periods. Links to relevant data sources are included where possible.
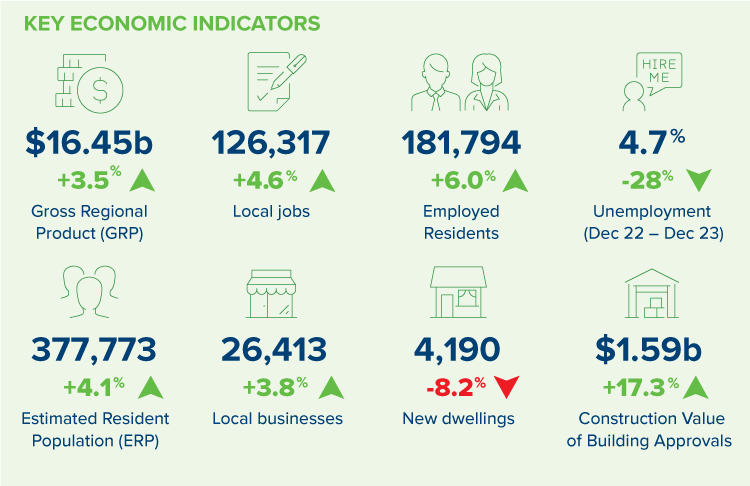
Key Economic Indicators
Gross Regional Product (GRP)
The City of Logan’s Gross Regional Product (GRP) at June 2023 was $16.45 billion, an increase of 3.5% since June 2022.
Growth has moderated since the post-COVID surge, but is still higher than the state average of 2.4%. Additionally the City of Logan’s GRP as a percentage of Gross State Product is the highest it has ever been at 3.54%.
Growth in Logan is being driven by construction, manufacturing, and health care and social assistance industries.
[wpdatatable id=42]
Industry
Construction continues to be the biggest industry in the city by economic output, generating $6.7 billion in 2022/23 – however output has fallen by $415 million from June 22 (adjusted for inflation). Manufacturing has also seen a reduction in output, as has the Retail Trade sector and Public Administration and Safety.
- Construction – $6.7 billion (-$415 million from 2021/22)
- Manufacturing – $4.18 billion (-$97 million)
- Health Care and Social Assistance – $2.65 billion (+$230 million)
- Transport, Postal and Warehousing – $2.01 billion (+$112 million)
[wpdatachart id=28]
Three industries saw a reduction of output in the 12 months to June 2023
- Manufacturing: $4.18 billion (-$97 million)
- Public Administration and Safety: $1.01 billion (-$21 million)
- Retail Trade: $1.59 billion (-$8 million)
The top performing industries over the last 5 years are
- Manufacturing: +$2.33 billion
- Health Care and Social Assistance: +$915 million
- Rental, Hiring and Real Estate Services: +$389 million
- Transport, Postal and Warehousing: +$266 million
- Public Administration and Safety: +$244 million
Retail Trade is the only industry with a lower output figure than 2018, down $18 million over the 5-year period, which is only 1%.
Manufacturing is the city’s biggest exporter with a value of $1.96 billion. Food Manufacturing, Primary Metal and Metal Product Manufacturing, Fabricated Metal Product Manufacturing, Petroleum and Coal Product Manufacturing, and Polymer Product and Rubber Product Manufacturing make up the majority of this industry.
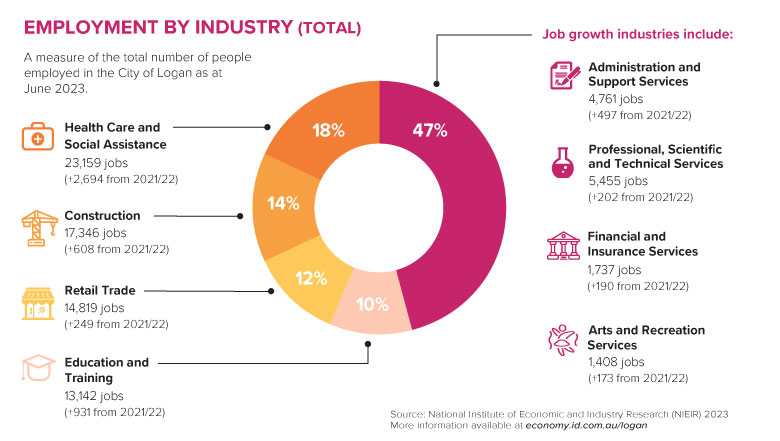
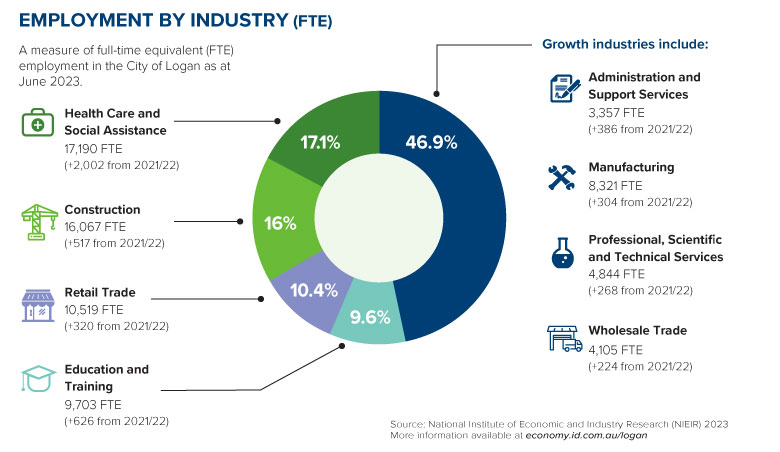
Employment
The top employing industries as at June 2023
- Health Care and Social Assistance – 23,159 jobs (+2,694 from 2021/22)
- Construction – 17,346 jobs (+608)
- Retail Trade – 14,819 jobs (+249)
- Education and Training – 13,142 jobs (+931)
Local Jobs
There were 126,317 jobs located in the City of Logan in the year ending June 2023. This represents a 4.6% increase from 120,729 jobs at June 2022.
Logan has recorded strong local jobs growth of 14.8% from June 2018 to June 2023. Local jobs growth has cooled from its all-time high of 6.32% in 2022, down to 4.63% in June, but is still above the Queensland average of 3.66%.
[wpdatatable id=43]
The 2021 Census data showed that for the 102,853 local jobs in the city, 59% of those were occupied by Logan residents. The other 41% of workers live in other Council areas and commute into the city for work. Main residential locations include Brisbane (20.4%), Gold Coast (8.7%), Redland (4.2%) and Ipswich (3.6%).
Local workers
Of the 151,633 employed Logan residents in the 2021 Census data, 40% live and work in the City of Logan, 54.1% travel outside the city for work, and 5.9% have no fixed place of work. Brisbane was the main employment centre, with 57,120 (37.7%) Logan residents travelling to the Brisbane Council area for work.
Employed locals
There were 181,794 Logan residents in employment at June 2023. This is a 6% increase from 171,502 from June 2022.
Unemployment (Dec 2023 data)
The unemployment rate has been trending downwards since September 2021 and is 4.7% for the December 2023 quarter, the lowest it has been for at least 10 years.
[wpdatatable id=46 table_view=regular]
Areas with the lowest unemployment rate
- Cornubia – Carbrook – 1.4%
- Shailer Park – 1.7%
- Wolffedene – Bahrs Scrub – 2.0%
- Rochdale South – Priestdale – 2.1%
- Springwood – 2.1%
- Daisy Hill – 2.2%
- Logan Village – 2.3%
Areas with the highest unemployment rate
- Logan Central – 16.5%
- Woodridge – 15.9%
- Kingston – 14.1%
- Loganlea – 8.4%
- Slacks Creek – 8.3%
Areas with most improved unemployment rate over the last 12 months
- Springwood (3.6% to 2.1%) -71%
- Mount Warren Park (5.5% to 3.3%) -67%
- Cornubia – Carbrook (2.3% to 1.4%) -64%
- Underwood (3.9% to 2.5%) -56%
- Loganholme – Tanah Merah (4.0% to 2.6%) -54%
The Youth Unemployment Rate for Logan – Beaudesert was 10.4% at April 2024. The youth unemployment rate started to drop during the 2022/23 financial year from 15.8% in June 2022 to 10.5% in June 2023. The rate has remained fairly stable during 2023/24 so far with the rate at its lowest in October 23 (8.5%) and travelling upward to 10.4% in April 2024.
Local Businesses
There was a net increase of 962 local businesses from June 2022 to June 2023, to 26,413 businesses. The highest amount of new businesses were in the Transport, Postal and Warehousing, Construction, and Healthcare and Social Assistance industries. 97.6% of businesses in Logan are sole traders or small businesses (less than 20 employees)
Number of businesses by turnover
- Zero to less than $50k – 5,582
- $50k to less than $200k – 9,716
- $200k to less than $2m – 8,969
- $2m to less than $5m – 1,084
- $5m to less than $10m – 386
- $10m or more – 376
Number of businesses by employment size
- Non employing – 15,906
- 1-4 employees – 7,559
- 5-19 employees – 2,315
- 20-199 employees – 606
- 200+ employees – 27
Population
The Estimated Resident Population of the City of Logan is 377,773 as at June 2023. This is a 4.1% increase from 2021/22 and makes Logan the fastest growing LGA in Queensland. The 5-year average growth is 3.1%.
[wpdatatable id=44]
Estimated population growth is highest in the following SA2 areas
- Chambers Flat – Logan Reserve – +18.4%
- Greenbank – North Maclean – +12.9%
- Boronia Heights – Park Ridge – +9.3%
- Yarrabilba – +7.9%
- Wolffdene – Bahrs Scrub – +7.7%
Brisbane, Gold Coast, Moreton Bay and Logan were the top 4 LGA’s for overseas migration. Logan had the highest amount of net internal migration in QLD and the 2nd highest nationally (more Australians are moving to Logan than any other Council area in Queensland, and 2nd nationally only behind Melton, VIC).
Logan has the 4th highest population density in QLD (behind Brisbane, Gold Coast and Weipa).
Development Activity Highlights
- Estimated construction value of Building Completions in 2022/23 was $1.59 billion, up 17% from $1.35 billion in 2021/22.
- 250,845m² of new non-residential Gross Floor Area (GFA) space completed in 2022/23 (excludes mixed use), which is a 8% decrease from 2021/22.
- The biggest increases in non-residential growth occurred in Warehouse, Distribution & Logistics with 180,107m² of new floor space (GFA).
- Estimated construction value of all new Building Approvals was $2.08 billion for 2022/23, up 10.8% from $1.87 billion in 2021/22.
- Estimated construction value of new non-residential work (based on Building Approvals) is $401,045,389 (excludes mixed-use, demolitions, alterations and fit-outs).
- Over 4,100 new dwellings have been added to the city’s housing stock (130,109 as at June 2022). This is a decrease from 4,500 dwellings added in 2021/22. Of these additional dwellings, the most popular dwelling type was a stand-alone house, followed by a house with a secondary dwelling/auxiliary unit.
- The medium construction value for residential dwellings continue to increase with the median cost of a stand-alone house increasing to $355,760 in 2022/23 from $303,250 in 2021/22.
- The average construction timeframes for residential dwellings continue to increase with a stand-alone home taking an average of 230 business days from approval to completion in 2022/23 which is an increase from 194 days in 2021/22.
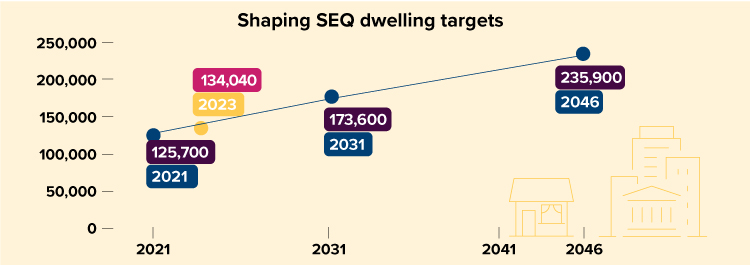
- Logan is currently below our dwelling number targets that are set by the State Government’s SEQ Regional Plan. As at June 2023 the city has 134,040 dwellings moving towards 235,900 by 2046.
Top 5 suburbs for residential dwelling completions were
- Logan Reserve – 959
- Park Ridge – 546
- Greenbank – 475
- Yarrabilba – 281
- Flagstone – 208
Census Comparison Data
To see changes to the City of Logan’s demographic data from the 2016 Census to the 2021 Census, see our fact sheet.
Sources
Australian Bureau of Statistics, Counts of Australian Businesses, including Entries and Exits, 2017 to 2023
Australian Bureau of Statistics, Estimated Resident Population (ERP) and components by Local Government Area 2017 to 2023
Economy.id industry structure and industry sector profiles use a National Accounts regional econometric model developed by National Institute of Economic and Industry Research (NIEIR) economy.id.com.au
Urban Research & Monitoring Unit, Economic Development and City Planning Branch, Logan City Council
Small Area Labour Markets Australia, Australian Government, Department of Employment, Skills, Small & Family Business, ABS State Details
Queensland Government Statistician’s Office – Regional youth unemployment
*Many of the datasets in this economic profile are underpinned by the NIEIR-ID economic model, which is updated each financial year. As benchmarks are changed every year, this can affect historical figures.