City of Logan Residential Building Approvals
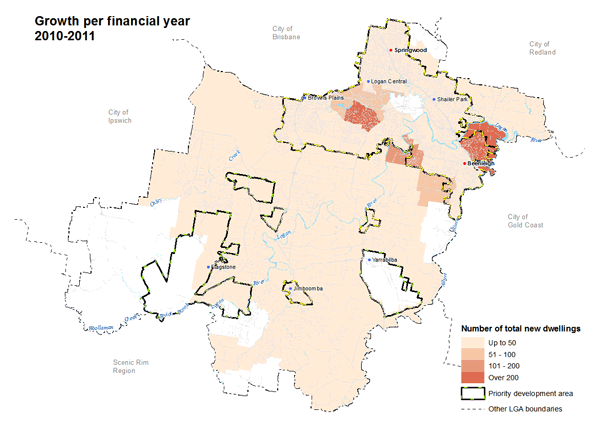
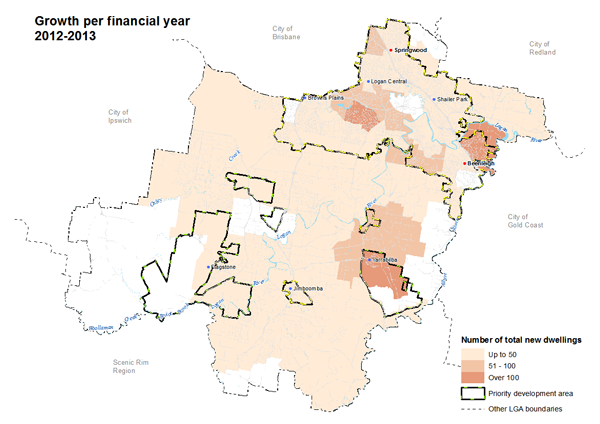
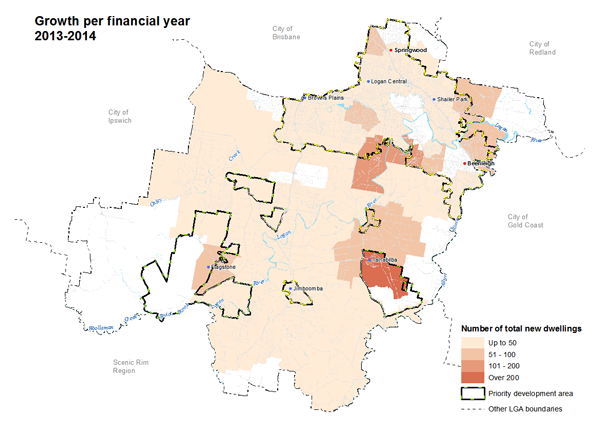
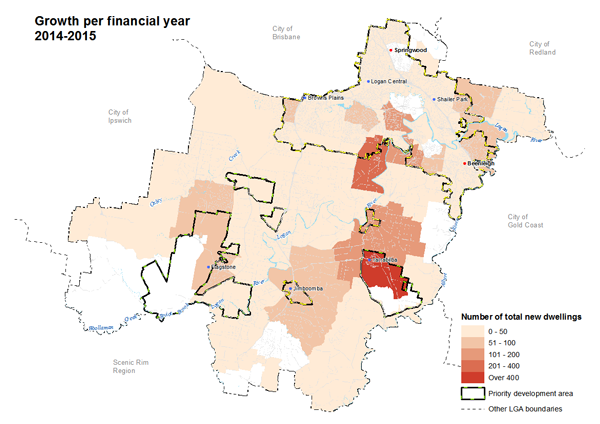
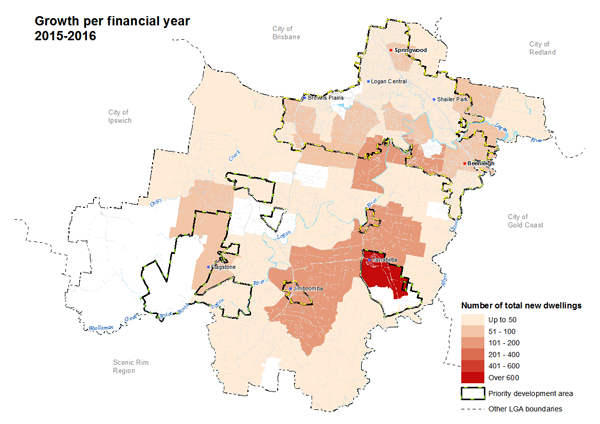
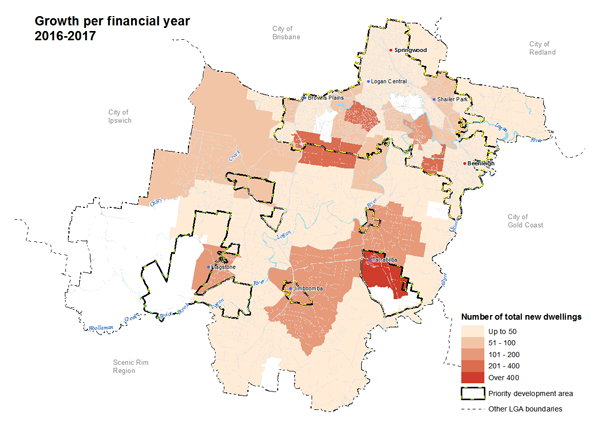
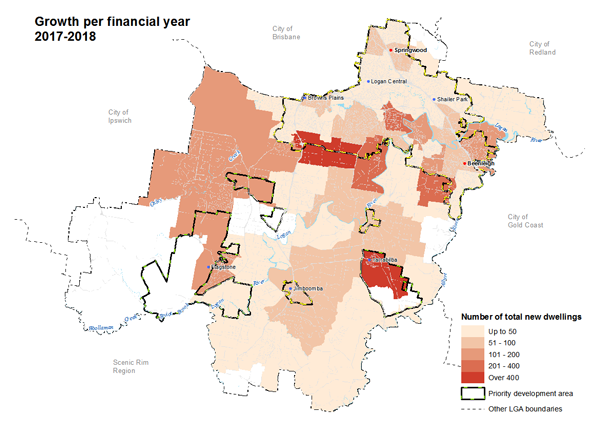
New dwellings approved from 2010/2011 through to 2018/2019

New dwellings approved by housing type – financial year totals 2010/2011 through to 2018/2019
| Housing type | 10/11 | 11/12 | 12/13 | 13/14 | 14/15 | 15/16 | 16/17 | 17/18 | 18/19 | Total |
|---|---|---|---|---|---|---|---|---|---|---|
| Unit / apartment | 205 | 257 | 343 | 43 | 122 | 226 | 109 | 293 | 230 | 1,828 |
| Duplex / townhouse | 324 | 267 | 197 | 218 | 228 | 212 | 292 | 150 | 476 | 2,364 |
| Stand-alone house | 879 | 781 | 746 | 1,208 | 1,838 | 2,025 | 2,056 | 2,293 | 2,028 | 13,854 |
| House with auxiliary unit | 6 | – | 4 | 4 | 50 | 294 | 524 | 826 | 592 | 2,300 |
| Secondary dwelling for existing dwelling | 32 | 41 | 59 | 57 | 85 | 113 | 149 | 262 | 119 | 917 |
| Other dwelling | 85 | 120 | 57 | 59 | 112 | 97 | 78 | 102 | 52 | 762 |
| Retirement dwelling | 55 | 62 | 83 | 46 | 12 | 53 | 76 | 50 | 57 | 494 |
| Total new dwellings | 1,586 | 1,528 | 1,489 | 1,635 | 2,447 | 3,020 | 3,284 | 3,976 | 3,554 | 22,519 |
| Total dwellings demolished | 36 | 39 | 47 | 52 | 63 | 72 | 86 | 113 | 146 | 654 |
| TOTAL NET new dwellings | 1,550 | 1,489 | 1,442 | 1,583 | 2,384 | 2,948 | 3,198 | 3,863 | 3,408 | 21,865 |

Graph – New dwellings approved by housing type – financial year totals 2010/2011 through to 2018/2019


Construction value of all new dwellings and other residential types (1) from 2010/2011 through to 2018/2019
.png "Graph-BA-Construction-value-dwellings")
- Includes the construction value of new care and other facilities with long term residency.
Construction value of all other residential building work (1) from 2010/2011 through to 2018/2019

- Includes the construction value of all residential related renovations, extensions and demolitions.
Median construction value of selected housing types from 2010/2011 through to 2018/2019

- The median construction value for stand-alone house is for houses on a lot less than 2,000m2.
Average Gross Floor Area (GFA) (1) and average floorspace (2) of Stand-alone houses from 2010/2011 through to 2018/2019

- GFA is defined as the habitable area of the Stand-alone house and excludes garages, patios, porches and other storage areas.
- Floorspace is defined as the entire area of the Stand-alone house that is under the roof and includes garages, patios, porches and storage areas.
Average Gross Floor Area (GFA) (1) and average floorspace (2) of House with auxillary unit from 2010/2011 through to 2018/2019

- GFA is defined as the habitable area of the House with auxiliary unit and excludes garages, patios, porches and other storage areas.
- Floorspace is defined as the entire area of the House with auxiliary unit that is under the roof and includes garages, patios, porches and storage areas.
Average Gross Floor Area (GFA) (1) of House with auxiliary unit (house component and auxiliary unit component) from 2010/2011 through to 2018/2019

- GFA is defined as the habitable area of the House with auxiliary unit and excludes garages, patios, porches and other storage areas.